Navigating the financial side of healthcare often feels like learning a foreign language. You face a wall of codes, modifiers, and fee schedules that seem designed to confuse. Yet, for anyone involved in medical billing, practice management, or even a patient trying to understand a medical bill, grasping how Medicare sets its prices is fundamental. This world revolves around one central concept: cms reimbursement rates by cpt code for medicare. It is the mechanism that determines how much a doctor, therapist, or other healthcare professional gets paid for a specific service.
We will walk through this complex system together. Think of this not as a dry regulatory manual, but as a conversation. I want to explain the logic, the tools, and the practical steps you need to find accurate payment information. By the time you finish reading, you will have a clear, realistic understanding of how the Centers for Medicare & Medicaid Services (CMS) calculates payments, where to find the exact dollar amounts, and how to interpret the data you see. We will leave the confusing jargon behind and focus on what actually matters.
Our journey will take us from the basic building blocks of the payment system to the advanced nuances of geographic adjustments and policy changes. We will look at real code examples, break down dense tables, and clarify the most common points of confusion. Most importantly, everything you read here remains grounded in official, publicly available information. You will not find speculation, leaked data, or unrealistic promises. You will find a reliable, deep resource you can return to whenever the Medicare fee schedule feels overwhelming. Let’s start building that foundation.
The Foundation of Medicare Physician Payment
Before you can look up a specific dollar amount for a service, you need to understand the machine that produces that number. The system did not appear overnight. It evolved through acts of Congress and careful calibration by CMS. Knowing this context transforms a simple lookup task into a strategic skill. You move from merely finding a number to understanding why that number exists and what levers can change it over time.
What is the Medicare Physician Fee Schedule (MPFS)?
The Medicare Physician Fee Schedule, or MPFS, is the master list of payment rates Medicare uses to reimburse physicians and other healthcare professionals for their services. When you hear someone talk about cms reimbursement rates by cpt code for medicare, they are almost always referring to the MPFS. This document covers over 10,000 unique healthcare services, from a routine office visit to a complex surgical procedure. Congress created the modern version of this system through the Omnibus Budget Reconciliation Act of 1989, which took effect in 1992. Before that, Medicare paid physicians based on their historical charges, a method that led to rapid inflation in healthcare spending.
The MPFS fundamentally changed the game. Instead of paying whatever a doctor charged, Medicare began paying based on the resources required to perform a service. This is a crucial shift in philosophy. The system no longer asks, “What did the doctor bill?” Instead, it asks, “What resources does it reasonably take to provide this care?” This resource-based approach aims to create a more equitable and predictable payment system. The MPFS is not static. CMS updates it annually through a formal rulemaking process, and the final rule typically appears in the Federal Register every November, taking effect the following January 1.
Every single Current Procedural Terminology (CPT) code that Medicare covers has a spot on this fee schedule. The schedule assigns a specific numeric value to each code, which then translates into a dollar amount. However, that dollar amount is not uniform across the country. The MPFS accounts for local variations in the cost of running a practice. This means the final cms reimbursement rates by cpt code for medicare you see for a service in Manhattan will differ from the rate in rural Iowa. The MPFS provides the formula, and local geographic indices provide the final variables.
The Three Pillars: Work, Practice Expense, and Malpractice RVUs
To truly understand the fee schedule, you must understand the Relative Value Unit, or RVU. An RVU is a numerical weight assigned to each service, reflecting its relative resource consumption compared to other services. The total RVU for a CPT code rests on three distinct pillars. Think of them as three ingredients in a recipe; each one is essential, and changing one changes the final product.
The first pillar is the Physician Work RVU (wRVU) . This component accounts for the physician’s time, technical skill, physical effort, mental effort, and psychological stress required to perform the service. It represents about 52% of the total RVU for a typical service. A neurosurgeon performing a complex spinal fusion earns a high work RVU because the procedure demands intense concentration, great technical precision, and significant risk to the patient. An office visit to check a stable blood pressure level requires less intensity and time, resulting in a lower work RVU. A special committee within the American Medical Association, the RVS Update Committee (RUC), surveys physicians extensively to recommend work RVU values to CMS. CMS reviews these recommendations and makes the final decision.
The second pillar is the Practice Expense RVU (peRVU) . This component covers the direct and indirect costs of running a medical practice. Direct costs include clinical staff time, disposable supplies, and medical equipment used during the specific encounter. Indirect costs cover the broader overhead: rent, utilities, administrative staff salaries, and general office equipment. The peRVU varies significantly between a facility setting, like a hospital outpatient department, and a non-facility setting, like a private doctor’s office. CMS pays a higher peRVU for services performed in a non-facility setting because the practice bears all the overhead costs directly. This is a critical distinction we will explore in detail later.
The third pillar is the Professional Liability Insurance RVU (mpRVU) . This is the smallest component, usually around 4% of the total. It covers the cost of medical malpractice insurance premiums for the specialty performing the service. A high-risk surgical specialty will have a higher mpRVU for its services than a low-risk primary care specialty. CMS calculates this value using premium data from multiple states and specialty-specific risk factors.
The Conversion Factor: Turning Value into Dollars
If RVUs are the ingredients, the Conversion Factor (CF) is the oven that bakes them into a finished product. The CF is a single dollar amount set by Congress and CMS each year. You multiply the sum of the three geographically adjusted RVUs by the CF to get the final Medicare payment amount. This simple multiplication step is where policy and budget meet clinical reality.
The formula looks like this:
Total Payment = [(wRVU × Geographic Index for Work) + (peRVU × Geographic Index for Practice Expense) + (mpRVU × Geographic Index for Malpractice)] × Conversion Factor
The CF is the primary budget-neutrality lever. If CMS increases RVUs for a set of services, it may adjust the CF downward to keep total spending in line with targets. For many years, the Sustainable Growth Rate (SGR) formula threatened catastrophic cuts to the CF. Congress repeatedly intervened with short-term patches. In 2015, the Medicare Access and CHIP Reauthorization Act (MACRA) permanently repealed the SGR and established a new system with modest, predictable updates to the CF. The CF for 2024 is $32.7442. This number drops slightly in 2025, a reality that has significant implications for practice finances. Knowing the CF allows you to quickly estimate payment once you know a code’s total RVU. It is the key that unlocks the translation from abstract value to actual dollars.
Where to Find Official CMS Reimbursement Data
You have the theoretical foundation. Now, you need the practical tools. Searching for cms reimbursement rates by cpt code for medicare on a general search engine often leads you to third-party websites, some of which contain outdated or incorrect information. Relying on unofficial sources is a dangerous game in a field governed by strict compliance rules. You need to go straight to the source. CMS provides several official, free tools that allow you to look up payment rates with complete confidence. Learning to use these tools feels like gaining access to the control room after only seeing the public lobby.
Navigating the Physician Fee Schedule Lookup Tool
The CMS Physician Fee Schedule Lookup Tool is your primary resource for finding precise payment information for individual codes. It is a web-based application that queries the MPFS database directly. You do not need a special login or subscription. The tool sits publicly on the CMS website, available to anyone with an internet connection. Here is a practical walkthrough to help you navigate it effectively.
When you first open the tool, you will see a series of search fields. Start by selecting the year you are interested in. The database contains records going back many years, which is useful for historical analysis. Next, you will choose your pricing information. The default is “Pricing Amounts,” which shows the non-facility and facility fees. You then have several options to specify your search criteria. You can enter a single Healthcare Common Procedure Coding System (HCPCS) code, a range of codes, or a specific CPT code. If you know the exact code, this is the fastest method.
After entering the code, you must select a locality or leave the default as “All localities.” The locality is critical because it determines the geographic adjustment. If you select “All localities,” the tool will show you a national average or a list of all localities, depending on your other settings. For a precise payment in a specific area, you must select the correct state and, if applicable, the specific locality within that state. Florida, for example, has several localities, including a rest-of-state rural area and distinct urban areas like Miami. Arizona has a single statewide locality. Once you submit, the tool returns a detailed table. You will see the code, its description, the status code, and the breakdown of RVUs for work, practice expense, and malpractice. Most importantly, you will see the final non-facility and facility payment amounts. These are the official cms reimbursement rates by cpt code for medicare.
Understanding the Physician Fee Schedule (PFS) Relative Value Files
For a wider view, you need the PFS Relative Value Files. These are downloadable, comma-separated value (CSV) files available on the CMS website alongside the annual Final Rule. These files contain the complete RVU and payment information for every single code for the entire year. The CSV format allows you to open the data in Microsoft Excel, Google Sheets, or any data analysis software. This is the tool for people who need to analyze patterns, update entire billing systems, or research reimbursement across multiple codes.
The files can feel intimidating at first glance. They contain hundreds of columns of data. You do not need all of them. I recommend focusing on the essential columns. The first essential column is the HCPCS code. The next is the short description. Then, you want the columns labeled “Work RVU,” “Non-Facility PE RVU,” “Facility PE RVU,” “MP RVU,” and “Total Non-Facility RVU” and “Total Facility RVU.” Finally, you have the geographically adjusted payment amount columns, which show the calculation for a specific conversion factor and a zero-geographic-index locality, essentially a national unadjusted rate. You must apply your own geographic practice cost index (GPCI) to get the exact local rate. A separate file contains all the GPCI values for every Medicare locality in the country.
Important Note: The CSV files use a zero GPCI as a baseline for the payment columns. You must multiply these amounts by your local GPCI to get the precise dollar amount for your area. CMS provides detailed instructions in the “readme” file accompanying the data.
Locality-Specific Data and Geographic Practice Cost Indices (GPCI)
A national payment rate is an abstraction. No one practices in a national average. The cost of clinical staff, office rent, and even professional liability insurance varies enormously between New York City and Boise, Idaho. CMS uses Geographic Practice Cost Indices, or GPCIs, to make the MPFS fair and accurate across different regions. This is the final critical piece in calculating true cms reimbursement rates by cpt code for medicare.
There are three separate GPCIs, one for each RVU component. The Work GPCI adjusts the Physician Work RVU. The Practice Expense GPCI adjusts the Practice Expense RVU. The Malpractice GPCI adjusts the Malpractice Expense RVU. Each Medicare payment locality, of which there are over 100, has its own set of three GPCIs. An index of 1.0 means the cost in that locality is identical to the national average. An index of 1.10 means costs are 10% higher than average. An index of 0.90 means costs are 10% lower.
Consider a clear example. Manhattan’s Work GPCI is often around 1.05, and its Practice Expense GPCI can be significantly higher. This means the same office visit with the same total RVU pays considerably more in Manhattan than in a rural area with GPCIs below 1.0. The system reflects economic reality. You can find the official GPCI list for each year in the Addendum E file of the annual MPFS Final Rule. This file provides the exact index for every Medicare locality. When you build your own payment calculator in a spreadsheet, you will reference this addendum to ensure your numbers are flawless.
| RVU Component | National Average Index | High-Cost Locality Example (Manhattan, NY) | Low-Cost Locality Example (Rural Mississippi) |
|---|---|---|---|
| Work GPCI | 1.000 | 1.053 | 1.000 |
| Practice Expense GPCI | 1.000 | 1.336 | 0.859 |
| Malpractice GPCI | 1.000 | 1.416 | 0.441 |
Note: The figures in this table are illustrative, based on historical trends. Always consult the official Addendum E for current year GPCI values.
Deconstructing a CPT Code Payment: A Step-by-Step Example
The theoretical framework and data files are essential, but a concrete example brings the process to life. Let’s follow the path of a single, common CPT code from its RVU components to its final dollar amount in a specific location. This exercise will turn you from a passive reader into an active analyst. You will see how the three pillars and the conversion factor work together to produce the final cms reimbursement rates by cpt code for medicare.
Case Study: Evaluation and Management Code 99213
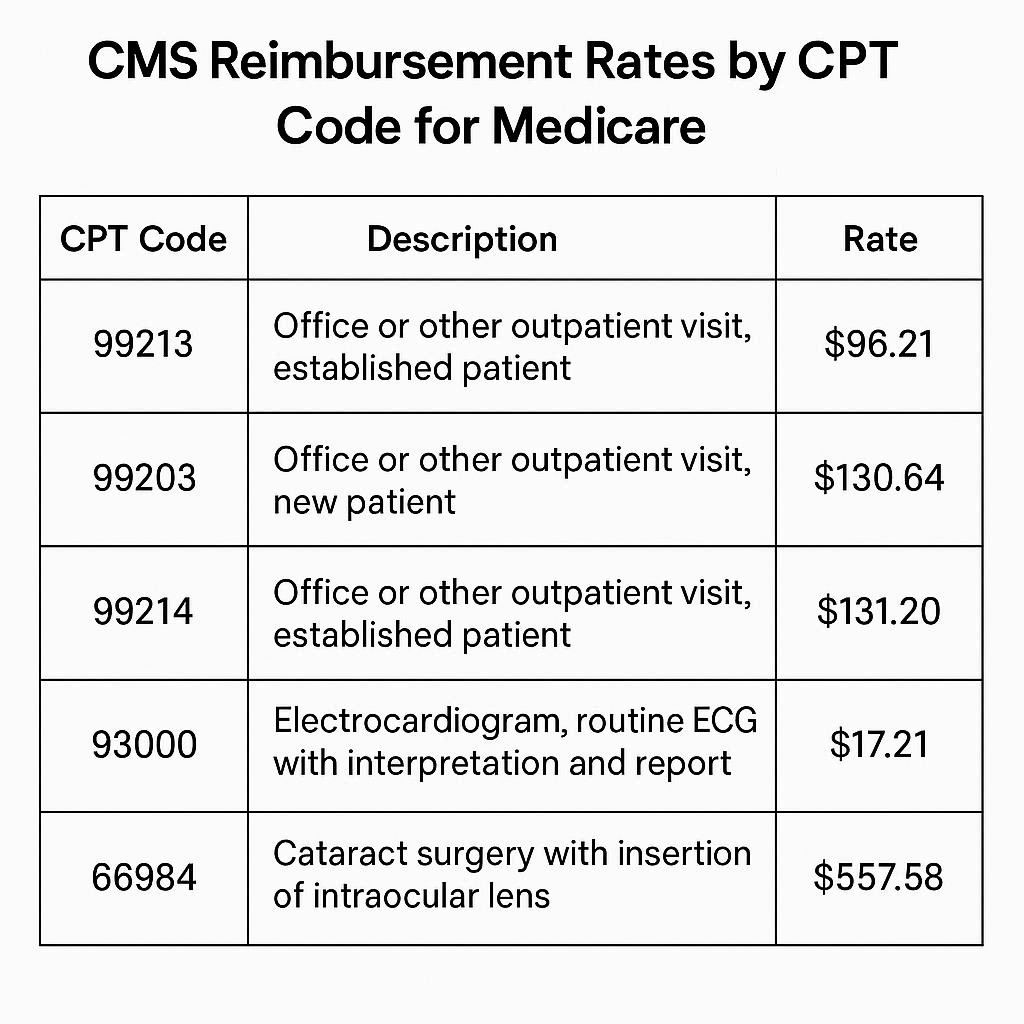
We will use CPT code 99213, a standard established patient office visit. This is one of the most frequently billed codes in all of American medicine. It represents a mid-level visit requiring a medically appropriate history and examination and a low level of medical decision-making. This code falls into the Evaluation and Management (E/M) category, the core of primary care and many specialty outpatient practices.
First, let’s look at the national, unadjusted RVU breakdown for 2024. According to the official MPFS files, the Physician Work RVU is 1.30. The Practice Expense RVU for a non-facility setting (a standard doctor’s office) is 1.05. The Malpractice RVU is 0.09. The Practice Expense RVU for a facility setting (like a hospital outpatient department) is much lower, at 0.37, because the facility incurs the significant overhead costs.
Now, we add the three RVUs together for a non-facility setting:
1.30 (Work) + 1.05 (Non-Facility PE) + 0.09 (MP) = 2.44 Total Non-Facility RVU
For a facility setting:
1.30 (Work) + 0.37 (Facility PE) + 0.09 (MP) = 1.76 Total Facility RVU
The 2024 Conversion Factor is $32.7442. Therefore, the national unadjusted payment rates are:
Non-Facility: 2.44 × $32.7442 = $79.90
Facility: 1.76 × $32.7442 = $57.63
This $22.27 difference represents the higher overhead cost borne by an independent practice. Medicare compensates the practice directly for those expenses in the non-facility rate.
Applying the Geographic Adjustment (Example: Miami, FL)
A national rate is a baseline. Let’s make this real for a doctor practicing in Miami, Florida. We need the specific GPCI values for the Miami Medicare locality for 2024. Let’s assume, for this illustrative example, the Miami GPCIs are: Work GPCI: 1.020, Practice Expense GPCI: 1.060, Malpractice GPCI: 2.100. (Florida is a high-risk malpractice state, hence the elevated Malpractice GPCI).
We now recalculate the payment by multiplying each RVU component by its corresponding GPCI before summing them and multiplying by the CF.
Miami Adjusted Non-Facility Calculation:
Adjusted Work RVU = 1.30 × 1.020 = 1.326
Adjusted PE RVU = 1.05 × 1.060 = 1.113
Adjusted MP RVU = 0.09 × 2.100 = 0.189
Adjusted Total RVU = 1.326 + 1.113 + 0.189 = 2.628
Miami Non-Facility Payment = 2.628 × $32.7442 = **$86.05**
Miami Adjusted Facility Calculation:
Adjusted Work RVU = 1.30 × 1.020 = 1.326
Adjusted PE RVU = 0.37 × 1.060 = 0.392
Adjusted MP RVU = 0.09 × 2.100 = 0.189
Adjusted Total RVU = 1.326 + 0.392 + 0.189 = 1.907
Miami Facility Payment = 1.907 × $32.7442 = **$62.44**
Look at the difference. The same 99213 service that pays a national average of $79.90 in a non-facility setting pays $86.05 in Miami. This geographic adjustment is not a bonus; it compensates the practice for the higher real-world costs of providing care in that specific location. When you search for cms reimbursement rates by cpt code for medicare, you must carry this location-specific lens. A rate without a location is an incomplete picture.
Decoding the Place of Service: Facility vs. Non-Facility Rates
The case study above highlighted a major concept that demands a deeper dive. Why are there two different rates for the same code, and what determines which one applies? The answer lies in the “place of service,” and misunderstanding this leads to significant billing errors and compliance risks. The choice between a facility and a non-facility rate depends entirely on who owns and operates the physical space where the service occurs.
Why 99213 Pays Differently in an Office vs. a Hospital
This split payment structure exists to prevent Medicare from paying twice for the same overhead. When you visit a doctor in a private, freestanding office, that practice pays for the rent, the utilities, the clinical assistants, the computers, the exam table paper, and everything else. The non-facility practice expense RVU is higher because it bundles all those direct and indirect costs directly into the physician’s payment.
Now, picture a visit to a hospital outpatient department (HOPD). The hospital owns the building, provides the nursing staff, maintains the equipment, and covers the utilities. The physician is typically using the hospital’s resources. Medicare pays the hospital separately for the facility overhead through the Outpatient Prospective Payment System (OPPS). Paying the physician the full non-facility rate as well would mean the government is paying twice for the same overhead costs. Therefore, the facility rate for the physician is lower. It strips out the practice expense costs already covered by the payment to the hospital. The physician’s facility rate covers their professional work and malpractice insurance, but the hospital takes care of the rest.
This system also applies to Ambulatory Surgical Centers (ASCs). A surgeon performing a procedure in an ASC receives the facility rate from Medicare. The ASC itself receives a separate facility fee. Confusion often arises with services like interpreting a diagnostic test. The cardiologist who travels to the hospital to perform a cardiac catheterization and read the results bills the professional component only, which is the facility rate. The office where they see follow-up patients bills the non-facility rate. The key question is always: Whose resources support this specific service?
| Place of Service | Who Bears the Overhead Cost? | PE RVU Level | Payment Result |
|---|---|---|---|
| Non-Facility (Private Office, Clinic) | The physician’s practice directly. | Higher PE RVU. | Higher physician payment. |
| Facility (Hospital, ASC, SNF) | The institution; Medicare pays the institution a separate fee. | Lower PE RVU. | Lower physician payment. |
The Two-Service Rule: Identifying Global, Technical, and Professional Components
Further complexity arises with surgical and radiological codes. Many CPT codes represent a “global” package. This global service includes the pre-operative work, the surgical procedure itself, and the post-operative follow-up care. However, sometimes a physician performs only the surgery, and another doctor handles all follow-up. Or, a radiologist only interprets an X-ray but does not own the machine. The MPFS allows you to bill for these components separately.
The Professional Component (PC) represents the physician’s work of interpreting a test or performing a procedure. On the fee schedule, this is denoted by the modifier “-26” attached to the CPT code. The Technical Component (TC) represents the cost of the equipment, technologist, and physical space. This is denoted by modifier “-TC.” The Global Service is the combination of both, with no modifier. The total non-facility RVU for a global code covers both the professional and technical components. The facility RVU for the global code is often much lower, primarily reflecting the professional work, because the facility bills for the technical component.
Consider a chest X-ray, CPT code 71045. A radiologist in an independent imaging center performs and interprets the X-ray. The center bills the global code 71045, which gives a non-facility rate reflecting their ownership of the machine and the interpretation. Now, imagine a hospital owns the X-ray machine, and the radiologist only comes to read the image. The hospital bills the technical component (71045-TC). The radiologist bills the professional component (71045-26) and receives a payment equivalent to the facility rate. If you only need the interpretation for a scan performed elsewhere, you look up the facility payment for that code in the MPFS. This represents the physician’s work RVU plus the malpractice RVU, with a much smaller practice expense RVU.
The Broader Medical Coding Landscape
While CPT codes form the backbone of the MPFS, the system does not stop there. Medicare uses a broader set of codes called the Healthcare Common Procedure Coding System, or HCPCS. To master cms reimbursement rates by cpt code for medicare, you need a working knowledge of how other code sets interact with the fee schedule, particularly for services, drugs, and supplies that CPT codes do not cover.
HCPCS Level II: Beyond CPT Codes
HCPCS Level II codes, often pronounced “hick-picks,” are a national standard code set used primarily to identify products, supplies, and services not included in the CPT code set. This includes ambulance services, durable medical equipment (DME), prosthetics, orthotics, and certain drugs and biologicals administered in an outpatient setting. These codes are almost always five characters, starting with a letter followed by four numbers.
For example, when a patient requires a specific wheelchair cushion, that product will have a HCPCS Level II code starting with ‘E’ for Durable Medical Equipment. When a physician injects a specific drug in the office, the drug itself is billed using a HCPCS Level II code starting with ‘J’. The physician also bills a CPT code for the administration service. The MPFS includes many HCPCS Level II codes, and their payment is determined using the same methodology. For drugs, the payment often reflects the Average Sales Price (ASP) of the drug plus a small percentage add-on, rather than a resource-based RVU calculation. The PFS Lookup Tool contains both CPT and relevant HCPCS Level II codes. Searching for a J-code like J1100 (an injection of dexamethasone sodium phosphate) will return a defined payment rate on the MPFS, not an RVU-based formula.
The Role of Ambulatory Payment Classifications (APCs)
The story changes when you move from the physician’s payment to the hospital’s payment. For hospital outpatient services, Medicare does not use the MPFS. It uses the Outpatient Prospective Payment System (OPPS), which pays for services based on Ambulatory Payment Classifications (APCs). An APC is a group of services that are clinically similar and require a comparable amount of resources.
Think of it this way: A cardiologist performs a cardiac catheterization in a hospital. The cardiologist bills a CPT code and gets paid the facility rate from the MPFS. The hospital, in turn, bills the same CPT code (and many other charges) to Medicare for the facility service. Medicare groups that CPT code into a specific APC and pays the hospital a single, bundled payment for that encounter. The APC payment covers the room, the nursing staff, the imaging equipment, and most supplies. Do not confuse the physician’s fee schedule with the hospital’s OPPS. Searching for cms reimbursement rates by cpt code for medicare gives you the physician’s professional fee, even in a facility. The hospital’s facility fee is a separate transaction with a different set of rates and rules, found in the OPPS Addendum A and Addendum B.
Factors that Influence the Annual Rates
The payment rate for a CPT code is not a fixed, eternal constant. It shifts every year, and sometimes several times within a year due to legislative action. Understanding the forces that create these shifts helps you anticipate changes and advocate effectively. The annual rulemaking cycle is a public process, and the final numbers represent a complex negotiation between budget neutrality, medical practice costs, and policy goals.
The Medicare Physician Fee Schedule Final Rule
Every year, CMS publishes a proposed rule in the Federal Register, usually around July. This document outlines all the proposed changes to the MPFS, including new RVU values, policy changes for specific codes, and the proposed Conversion Factor. The public has a 60-day comment period to submit feedback. Professional societies, patient advocacy groups, and individual clinicians all weigh in, arguing for or against specific proposals. CMS reviews these thousands of comments and, by early November, publishes the Final Rule.
The Final Rule is a lengthy, dense document, sometimes exceeding 2,000 pages. It is the definitive legal and operational guide for the coming year. It contains the finalized policy explanations, the updated RVU tables, and the final, budget-neutral Conversion Factor. The rates you look up using the PFS Lookup Tool are a direct reflection of this Final Rule. When a code sees a significant increase or decrease, the Final Rule’s preamble often explains the clinical rationale, the RUC survey data, or the statutory requirement behind the change. Staying informed through the proposed and final rules moves you from reactive surprise to proactive preparation.
The Conversion Factor Update and Budget Neutrality
The Conversion Factor is often the most politically charged number in the entire Medicare program. Congress sets a target for annual updates to the CF, but the update must also be budget-neutral. If CMS makes a change that will increase overall Medicare spending by $1 billion, the law requires it to reduce the CF proportionally to offset that $1 billion. This is the budget neutrality mechanism. In recent years, the CF has faced significant downward pressure from this requirement.
For 2024, the CF was $32.7442. For 2025, the CF dropped to an estimated $32.3562, a reduction of 2.83%. This decrease happened primarily because of a 0.00% base update from MACRA, offset by a large budget-neutrality adjustment. The primary driver of the required offset was the significant increase in the work RVU for the G2211 add-on code, a new chronic care management add-on to E/M visits. This single policy decision, which increased the valuation of primary and longitudinal care, created a spending surge that triggered a broad, across-the-board CF reduction. This reality means that even if a code’s RVUs stay flat, its total payment will drop slightly year-over-year due to a lower CF. Understanding the budget-neutrality rule explains why many clinicians see their per-service rate decline even as their specific code values remain stable.
Practice Expense Data and Refinement
While the Physician Work RVU gets much attention, the Practice Expense (PE) component undergoes constant refinement. CMS uses data from the Physician Practice Information (PPI) Survey, a multi-specialty, nationally representative survey of practice costs, to recalibrate the direct and indirect PE per hour. When the PPI data show a steep rise in staff wages or medical supply prices, the PE RVUs for codes using those resources will eventually increase. This process is not instantaneous; it lags behind real-time market changes.
Additionally, CMS periodically identifies services that are most often performed together in a single encounter and bundles their practice expenses into a single primary code. This prevents billing for overlapping overhead that is not truly duplicated. Codes designated with a status indicator of “B” on the fee schedule are always bundled into other services and are not paid separately. These codes represent services where the practice expense is considered a part of a more comprehensive, always-also-billed service. This bundling logic is central to maintaining the accuracy of the fee schedule and preventing unbundling.
A Practical Guide to Using the Data for Financial Planning
Raw data from a government database is useless if you cannot translate it into a working financial model for a real medical practice. The official cms reimbursement rates by cpt code for medicare serve as the anchor for all financial forecasting, contract negotiation, and revenue cycle analysis. You can move from passive data lookup to active financial strategy.
Benchmarking Your Practice’s Most Billed Codes
The first and most effective step is to run a utilization report from your own practice management system. Identify the top 20 to 30 CPT codes by charge volume. These codes typically represent 80% or more of your total practice revenue. Export this list and bring it into a spreadsheet. In the next column, pull the official Medicare non-facility rate for each code for your specific locality. In another column, list your actual average contracted rate from each major commercial payer. Now, create a simple ratio: Your Contracted Rate divided by the Local Medicare Rate.
This ratio is your most honest benchmark of payer performance. A ratio of 1.10 means the payer pays 10% above the local Medicare rate. A ratio of 0.90 means they pay 10% below. Many practices are shocked to discover how many of their contracts have drifted to below-Medicare levels over time. This analysis gives you hard data to support renegotiation requests. You can walk into a meeting and state, “Our average commercial-to-Medicare ratio for our top 20 codes is 0.93. We need to move back toward parity.” This direct, data-backed approach changes the dynamic from a request to a business justification.
Analyzing Financial Impact of RVU Changes
When CMS releases the Final Rule with new RVUs and a new CF, you have a window of time to quantify the impact before the January 1 implementation. Take your top CPT codes and place their current year RVUs and payments in one set of columns. In the next columns, input the new year’s RVUs and CF. Calculate the new payment. Immediately, you can identify the winners and losers in your specific mix of services. A primary care practice with many G2211-addable visits may see a total revenue increase despite the CF cut. A surgical practice with no G2211-eligible services may see a pure, uncompensated cut of 2-3%. This code-level modeling shows you the precise revenue gap you need to close through operational efficiency or volume growth. Without this model, you step into the new year blind.
The Medicare Rate as a Floor for Commercial Payer Negotiations
A common mistake is viewing the Medicare rate as a target for all payers. For many specialties, Medicare rates cover costs but do not provide a wide margin. Therefore, the Medicare rate should serve as a firm floor, not a ceiling or a target, for commercial contract negotiations. Commercial payers bring a different patient population and a different administrative burden, but the fundamental resources for a 99213 are the same regardless of the insurance card. Using Medicare’s resource-based calculation as your foundation, you can argue that any commercial rate below Medicare is logically indefensible. It suggests a private insurer is paying less for the same physician work, clinical staff time, and supplies than a public program designed to be budget-conscious. This framing is powerful. The data you pull directly from the CMS lookup tool is the irrefutable foundation for that argument.
A Crash Course in RVU Calculation
You have seen the components and a calculation example. Let’s now solidify this into a durable skill you can perform manually for any code, without a lookup tool, to deeply understand its valuation. Mastering this calculation turns you into a true expert.
The Final Calculation Formula
The formula we have used in pieces is worth stating again in a single, clean expression. This is the mathematical core of the entire Medicare Physician Fee Schedule.
Payment Amount = [(wRVU × Work GPCI) + (peRVU × PE GPCI) + (mpRVU × MP GPCI)] × Conversion Factor
You can calculate this for a non-facility or facility setting by substituting the appropriate peRVU value into the formula. You must also remember that if a code has a global period, the post-operative visits are included in the global wRVU, and you do not bill separately for them. This formula is your master key.
Manually Calculating Total RVU Without a Lookup Tool
Let’s practice with a new code. Find CPT code 27130, a total hip arthroplasty. Find its component RVUs. Let’s assume for this example the 2024 national RVUs are: Work RVU = 20.72, Facility PE RVU = 11.50, Malpractice RVU = 1.55. The total facility RVU is 20.72 + 11.50 + 1.55 = 33.77.
Now, calculate the national unadjusted payment for a facility setting: 33.77 total RVU × $32.7442 CF = $1,105.77. This is the payment for the surgical procedure and the standard 90 days of global follow-up care. A surgeon in private practice who performs this in a hospital receives this facility-based payment from Medicare. The hospital receives a much larger APC payment for the implant, operating room time, nursing, and recovery room.
Now, imagine a Medicare patient in Manhattan. You look up the Manhattan Work GPCI (1.053), PE GPCI (1.336), and MP GPCI (1.416). The adjusted total RVU is (20.72 × 1.053) + (11.50 × 1.336) + (1.55 × 1.416) = 21.82 + 15.36 + 2.20 = 39.38. The Manhattan payment is 39.38 × $32.7442 = $1,289.57. The same hip replacement pays $183.80 more in Manhattan than in the national unadjusted model. This is the geographic adjustment in action.
Common Pitfalls and Misunderstandings in RVU Calculation
A frequent error is using the wrong practice expense RVU. I have seen practices mistakenly apply the non-facility PE RVU to a service clearly performed in a hospital, inflating their expected revenue projections. Another pitfall involves codes with bilateral surgery indicators or multiple procedure reduction rules. Medicare applies a 50% reduction to the work RVU of the second and subsequent procedures when a surgeon performs multiple procedures in the same operative session.
The fee schedule lookup tool helps you avoid these errors because it applies the standard payment adjustment indicators. However, the CSV Relative Value Files contain columns for these indicators: the “BILAT SURG” indicator and the “MULT PROC” indicator. A value of “1” in the bilateral surgery column means the code’s payment is already based on a bilateral procedure, and no further reduction applies. A value of “2” means the 150% adjustment rule for bilateral procedures applies. Ignoring these indicators leads to inaccurate payment calculations. Always cross-reference the indicator columns when you build a deep financial model from the CSV files. The MPFS is more than just a sum of RVUs; it is a structured payment logic system.
A Practical Example: Calculating the Reimbursement of Two Common Codes
Theory needs application to stick. I will walk through two detailed examples that represent very different ends of the healthcare service spectrum. One is the most common non-procedural visit, and the other is a diagnostic imaging test with separate components. These examples will cement the entire workflow for finding cms reimbursement rates by cpt code for medicare.
Example 1: A Standard Office Visit (99214) in a Non-Facility Setting
CPT 99214 is a high-volume established patient visit requiring a moderate level of medical decision-making. We will calculate the 2024 payment for a non-facility office in Chicago, Illinois. First, we identify the national RVUs. For 2024, the Work RVU is 1.92. The Non-Facility PE RVU is 1.52. The Malpractice RVU is 0.13. The total non-facility RVU is 1.92 + 1.52 + 0.13 = 3.57.
Next, we need the Chicago-area locality GPCIs. The Chicago Medicare locality has the following approximate GPCIs for 2024: Work GPCI = 1.039, PE GPCI = 1.099, MP GPCI = 1.962. We now adjust each component:
Adjusted Work RVU = 1.92 × 1.039 = 1.9949
Adjusted PE RVU = 1.52 × 1.099 = 1.6705
Adjusted MP RVU = 0.13 × 1.962 = 0.2551
Total Adjusted RVU = 1.9949 + 1.6705 + 0.2551 = 3.9205
Finally, we multiply by the 2024 Conversion Factor of $32.7442.
3.9205 × $32.7442 = $128.37
For a 99214 performed in a private practice office in Chicago, the Medicare payment is $128.37. This figure is the definitive rate for that service in that location.
Example 2: A Diagnostic Echocardiogram (93306) and the Global Service Concept
Now, consider CPT code 93306, a complete transthoracic echocardiogram with spectral and color Doppler. This is a diagnostic test with both a technical component (the machine, the sonographer) and a professional component (the cardiologist’s interpretation). Let’s find the payment for the global service in a non-facility setting in Houston, Texas.
The national unadjusted RVUs for the global service are: Work RVU = 0.92, Non-Facility PE RVU = 2.75, Malpractice RVU = 0.11. Total Global Non-Facility RVU = 0.92 + 2.75 + 0.11 = 3.78.
The Houston Medicare locality GPCIs are approximately: Work GPCI = 1.027, PE GPCI = 1.000, MP GPCI = 0.843.
Adjusted Work RVU = 0.92 × 1.027 = 0.9448
Adjusted PE RVU = 2.75 × 1.000 = 2.7500
Adjusted MP RVU = 0.11 × 0.843 = 0.0927
Total Adjusted RVU = 0.9448 + 2.7500 + 0.0927 = 3.7875
3.7875 × $32.7442 CF = $124.02
The global payment to an independent cardiology office in Houston is $124.02. This covers both the technical cost of performing the echo and the professional interpretation.
If a cardiologist only interprets an echo performed in a hospital, they bill the professional component, modifier -26. The facility RVUs for the professional component are: Work RVU = 0.92, Facility PE RVU = 0.25, MP RVU = 0.11. The adjusted professional component payment in Houston would be considerably lower, around $40 to $45, because the hospital receives a separate, large payment for the technical component. This distinction is the difference between a successful radiology billing operation and a constant audit risk.
Real-World Applications Beyond Simple Lookups
Once you have the core skill of finding and calculating a rate, you can apply it to higher-level tasks that directly impact practice health and compliance. The data from the MPFS is not just for the billing office; it is a strategic asset for contract negotiation, budget forecasting, and clinical service line analysis.
Contract Negotiation Strategies Using Medicare Rates
You have built your benchmarking spreadsheet with your top codes and your payer rates. Now, you need a negotiation strategy. A very effective approach targets specific codes with high volume but a low commercial-to-Medicare ratio. Rather than demanding an across-the-board increase, you propose a targeted adjustment. “We see our contract pays us 88% of Medicare for 99213 and 99214, which represent 40% of our charges to your plan. We need a specific rate floor in our amendment to bring these evaluation and management codes to at least 100% of the current local Medicare rate.”
This targeted, data-driven argument is difficult for a payer to dismiss. It focuses the discussion on an objective, public benchmark. The cms reimbursement rates by cpt code for medicare provide an unassailable third-party standard. The payer might counter with market-based data, but the resource-based relative value scale remains the most methodologically rigorous valuation system in healthcare. You hold a strong hand.
Budgeting and Forecasting with Fee Schedule Data
Annual budgeting requires a baseline for expected revenue per visit. Your practice management system provides historical volumes. You apply the new year’s Medicare rates to your Medicare volume to lock down that portion of your projected revenue. For commercial payers tied to a Medicare-based fee schedule, you apply the same percentage update. If you know a payer’s contract states they pay “120% of the current year Medicare Fee Schedule,” and you see the Medicare rate for your top codes will decline by 2.83% due to the CF cut, you can immediately forecast a corresponding decline in commercial revenue for those codes. This precision allows you to make informed decisions about staffing, expansion, or expense reduction well before the changes hit your cash flow. You remove panic and replace it with planned action.
Identifying Underpaid Services in Your Specialty
Sometimes, the fee schedule itself contains the story of a service that is undervalued relative to its cognitive or technical intensity. By comparing the work RVU of a complex, time-consuming evaluation and management visit to a brief, high-tech procedure, you might see a per-hour compensation disparity. Geriatricians, endocrinologists, and infectious disease specialists, who primarily bill E/M codes, have long argued this point. Their cognitive work, heavy on complex data analysis and care coordination, receives a lower per-minute work RVU than many procedure-based specialties.
Pulling a side-by-side comparison of two codes from the MPFS and calculating the work RVU per typical minute provides objective evidence for this claim. This analysis is the foundation of advocacy efforts by specialty societies to the RUC and CMS. You can use the same technique to understand your own specialty’s economic landscape. If you are considering adding a new service line, looking at the work RVU relative to the required training, time, and risk tells you whether the service will be a financial generator or a loss leader. The data does not lie, even if it paints a difficult picture.
Advanced Tools and Sources for Experts
You have graduated from the basics. Let’s talk about the tools and sources that professional coders, auditors, and healthcare analysts use to stay at the cutting edge. These resources take you deeper than the public lookup tool and CSV files, providing the policy context and analytical power needed for true mastery.
The CMS PFS Final Rule Federal Register Publication
The ultimate primary source is the annual Final Rule as published in the Federal Register. The PDF is publicly available on the Federal Register website. Reading it is an acquired skill. The most valuable section for a financial analyst is the preamble, which discusses the changes to specific codes. Often, a table in the preamble will summarize the final RVU for controversial codes. The Addenda at the end of the document are equally crucial. Addendum B contains the final RVUs and payment indicators for every single code. Addendum E contains the final GPCIs. These addenda are often released as separate, downloadable Excel files, which are easier to work with than the full 2,000-page PDF.
The Role of Medicare Administrative Contractors (MACs)
CMS establishes national policy, but local payment execution often falls to Medicare Administrative Contractors (MACs). Your local MAC, like NGS, Palmetto GBA, or Novitas, processes claims for your region. While the MPFS sets the payment rate, the MAC writes the Local Coverage Determinations (LCDs). An LCD can specify the medical necessity criteria for a CPT code to be paid in your region. You can have a perfect MPFS payment rate for a service, but if your documentation does not satisfy your MAC’s LCD for that code, the claim will be denied. Always check your MAC’s website. The payment rate is half the battle; meeting the coverage criteria is the other half. The MPFS file itself includes a column for the LCD coverage indicator, signaling that a specific coverage determination might exist.
Specialty Society Advocacy and RUC Resources
Every major medical specialty society, from the American College of Surgeons to the American Academy of Family Physicians, has a team dedicated to physician payment policy. These organizations represent your specialty on the AMA’s RVS Update Committee (RUC) and advocate directly with CMS. Their websites often contain member-only resources, including detailed analyses of the Final Rule’s impact on your specific specialty. They produce code-level impact tables that show exactly which codes are gaining or losing value. Joining and actively reading your specialty society’s payment policy communications is one of the most effective ways to stay informed without sifting through the Federal Register yourself. They translate the policy into actionable intelligence for your practice.
Important Warning: Many commercial websites offer “free” MPFS lookups. They often embed their own advertisements or sell your search data. Worse, they may not update their database promptly when a new Final Rule takes effect. An outdated rate leads to incorrect bids, flawed budgets, and compliance exposure. The official CMS lookup tool and the downloadable CSV files from the official CMS site are the only sources you should use for critical financial decisions. They are free, authoritative, and current.
A Crash Course in CPT Code Structure and CMS’s Adoption
To look up a rate, you need the right code. Understanding how the CPT code set is organized and how CMS officially adopts new codes each year makes you a much more efficient researcher. You stop guessing and start navigating the codebook with purpose.
CPT codes are five-digit numeric codes maintained and copyrighted by the American Medical Association. They fall into three main categories. Category I codes are the standard, widely-used procedure and service codes we have been discussing. They represent the vast majority of the MPFS. Category II codes are optional, alphanumeric tracking codes used for performance measurement. Medicare does not pay for Category II codes. Category III codes are temporary codes for emerging technologies, services, and procedures. Some Category III codes do get an MPFS rate, but often after a local MAC establishes coverage.
The AMA updates the CPT code set annually, adding new codes, deleting obsolete ones, and revising existing definitions. These updates take effect on January 1. CMS must then decide how to value these new and revised codes for the Medicare program. Through the annual rulemaking process, CMS reviews the AMA’s RUC recommendations and establishes a work RVU, PE RVU, and MP RVU for each code. A new surgical code, for example, passes through the RUC’s rigorous survey and valuation process before CMS publishes its final decision in the November Final Rule. When you search for a code that has been significantly revised, you must ensure you are looking at the description and valuation for the correct year. Using last year’s description for a redefined code is a medical coding error that leads to a denied claim.
Summary and Key Takeaways
We have traveled from the basic philosophy of resource-based payment to the precise, step-by-step calculation of a dollar amount. The system known as cms reimbursement rates by cpt code for medicare is not a black box. It is a transparent, formula-driven mechanism built on three RVU pillars and a Conversion Factor, adjusted by local geographic indices. You now know that a payment rate is a specific answer to a precise question: for what code, in what place of service, in which locality, during which calendar year?
The power of this knowledge lies in its application. You can walk to the official CMS Physician Fee Schedule Lookup Tool with confidence, select your parameters correctly, and retrieve an authoritative rate. You can interpret a Relative Value File and build a dynamic financial model. More importantly, you can use this federal data as a strategic benchmark to negotiate fairer contracts, forecast your revenue with precision, and understand the annual policy changes that shape the business of your practice. This is not just billing; this is the economic command of your clinical work.
Keep this guide close. The formulas, the tables, and the explanations of the three pillars are your reference points. Whenever a new fee schedule appears, return to these fundamentals. The landscape shifts, but the underlying structure remains constant. Your ability to decode it is now permanent.
Conclusion
This article unpacked the entire process of finding and calculating Medicare physician payments, starting with the three resource-based value units (wRVU, peRVU, mpRVU) and the conversion factor that transforms them into a dollar amount. It provided a step-by-step guide to using official CMS tools, applying geographic cost indices, and distinguishing between facility and non-facility rates. Finally, it showed how to use these rates for strategic financial benchmarking, contract negotiation, and building a reliable practice budget.
Frequently Asked Questions (FAQ)
Where can I find the official cms reimbursement rates by cpt code for medicare?
The official source is the Physician Fee Schedule Lookup Tool on the official CMS website. You can also download the complete annual Relative Value Files in a CSV format. Always use these free, primary sources for financial planning and compliance.
Why are there two different payment rates for the same CPT code?
Medicare pays a higher non-facility rate for services performed in a private doctor’s office and a lower facility rate for services performed in a hospital or surgical center. This prevents duplicate payment for overhead costs, as the hospital receives a separate facility fee.
What is a geographic practice cost index (GPCI)?
A GPCI is a multiplier that adjusts the three RVU components (work, practice expense, malpractice) to reflect local cost differences. Each Medicare locality has a unique set of GPCIs, so a procedure in Manhattan pays more than the same procedure in a rural area.
What does the conversion factor represent, and why does it change?
The conversion factor is a single dollar figure that converts total adjusted RVUs into a final payment. It changes annually based on legislative updates and a mandatory budget-neutrality adjustment that offsets spending increases from other policy changes.
How do I calculate a Medicare payment from RVUs manually?
Multiply each RVU (Work, PE, MP) by its corresponding local GPCI to get adjusted RVUs. Sum these three adjusted values. Then, multiply the total adjusted RVU by the current year’s Conversion Factor. The formula is: Payment = [(wRVU × Work GPCI) + (peRVU × PE GPCI) + (mpRVU × MP GPCI)] × CF.
Additional Resource
For the official, downloadable Physician Fee Schedule Relative Value Files and the direct link to the PFS Lookup Tool, visit the CMS Physician Fee Schedule main page: https://www.cms.gov/medicare/payment/fee-schedules/physician
Disclaimer: This article provides informational guidance based on publicly available CMS data and policies. It does not constitute legal, coding, or billing advice. Healthcare providers and billers should always consult the current year’s official CMS Final Rule and their local Medicare Administrative Contractor (MAC) for specific coverage and billing requirements. Codes and payment rates in the examples are illustrative and subject to annual changes.
Copied from: CPT Codes Medical Billing Guide – DeepSeek – <https://chat.deepseek.com/a/chat/s/b5d0a693-b313-44d8-a188-ac371a4a3612>